
 Français
  Nederlands
  English
  Deutsch
 Hydraulic Profiling Tool
![hpt-probe[1]](http://www.geoprobe.be/wp-content/uploads/2015/04/hpt-probe1.jpg)
- HPT produces a detailed hydrostratigraphic log.
- Can be used to estimate hydraulic conductivity in the saturated zone.
- Logs both HPT injection pressure and electrical conductivity.
- Measures hydrostatic pressure and depth to water table.
- HPT logging is easy to learn and operate (click here for the user manual).
- Interpretation of HPT logs is straight forward and intuitive.
HPT Introduction:
The Hydraulic Profiling Tool is a logging tool that measures the pressure required to inject a flow of water into the soil as the probe is advanced into the subsurface. This injection pressure log is an excellent indicator of formation permeability (Fig. 1). In addition to measurement of injection pressure, the HPT can also be used to measure hydrostatic pressure under the zero flow condition. This allows the development of a hydrostatic pressure graph for the log and prediction of the position of the water table.
![fig-1-hpt-log[1]](http://www.geoprobe.be/wp-content/uploads/2015/04/fig-1-hpt-log1.gif)
Fig. 1 : A typical HPT Logging graph. The graph on the left is electrical conductivity (EC). The graph on the right is HPT injection pressure (top axis) with the hydrostatic pressure line (bottom axis). The bottom three triangles on the hydrostatic line represent hydrostatic pressure measurement points. The inflection point in the hydrostatic line is the predicted water table.
Measurement of the injection pressure in the HPT system is made using a downhole pressure transducer (Figure 3). Use of a transducer in the downhole position allows measurement of the injection pressure at the HPT screen only and excludes frictional losses through the flow tube of the HPT trunkline. The downhole transducer position is also necessary for making hydrostatic pressure measurements at the probe.
![hpt-figure-2[1]](http://www.geoprobe.be/wp-content/uploads/2015/04/hpt-figure-21.gif)
Fig. 2 : This probe is robust and percussion driveable (hammerable) with Geoprobe® direct push machines. Standard HPT probes are equipped with electrical pin arrays for measurement of soil electrical conductivity as a complementary log to the HPT log.
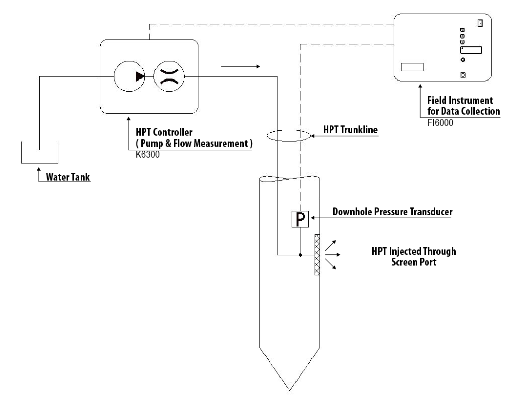 Fig. 3 : Uses of HPT: The primary log from the HPT system is the log of HPT injection pressure with depth. Again, refer to Figure 1 for an example of this log. Injection pressure correlates well with formation permeability and contributes to the chief use of the HPT: it gives the HPT user a view of permeability with depth.
With this log an experienced site investigator can determine permeable zones, potential contaminant or seepage flow paths, zones that will yield groundwater to samplers, or zones to set monitoring or production wells.
HPT logs are also used to develop lithologic cross sections of the subsurface (Figure 4). This is a powerful application of HPT, allowing the site investigator to trace aquifer materials or confining zones across a site. It also allows the comparison of lithology between locations based on apparent permeability.
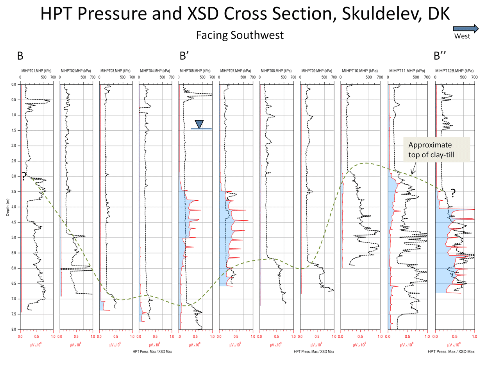 Fig. 4 : Cross section developed using HPT (black traces on logs). The HPT logs are shown here with collocated MIP logs. The dashed line on the cross section represents the contact between a glacial till (low permeability) and the overlying sands and gravels.
Formation hydraulic conductivity can be estimated from HPT logs using a empirical relationships developed for the tool. These estimations can be made automatically using the DI-Viewer software. A graph of hydraulic conductivity estimated from an HPT log is shown in Figure 5. Data from this estimate is readily transferable to groundwater flow models.
![figure-5-hpt-est-k[1]](http://www.geoprobe.be/wp-content/uploads/2015/04/figure-5-hpt-est-k1.gif) Fig. 5 : An HPT log showing estimated hydraulic conductivity (graph on right). This estimation can be made automatically in the DI Viewer software that is used to review HPT logs. Estimated hydraulic conductivity is only calculated for the saturated zone (below the water table, represented by the uppermost triangle on the hydrostatic pressure graph).
Fig. 5 : An HPT log showing estimated hydraulic conductivity (graph on right). This estimation can be made automatically in the DI Viewer software that is used to review HPT logs. Estimated hydraulic conductivity is only calculated for the saturated zone (below the water table, represented by the uppermost triangle on the hydrostatic pressure graph).
The HPT is also useful for the detection of brines or other high electrical conductivity fluids in soil.
These brines may originate from oilfield production or storage activities. Other high ionic fluids amenable to this technique include road salts and remediation fluids. Detection of these fluids is detected as an anomaly between the EC and HPT log. This occurs when the EC increases, in some cases even above that observed in background logs, while the HPT indicates a zone of high permeability. An example of this is shown in Figure 6.
![figure-6-hig-ec-waters[1]](http://www.geoprobe.be/wp-content/uploads/2015/04/figure-6-hig-ec-waters1.gif) Fig. 6 : An example of the detection of salt or brine contaminated groundwater using the HPT and EC logs.
Fig. 6 : An example of the detection of salt or brine contaminated groundwater using the HPT and EC logs.
In this case, the EC increases from baseline to maximum value in the 15 to 23 feet interval. At the same time the HPT pressure remains low, indicating that this is a zone of high permeability. The rise in EC in this case is caused by in increase in salt content in the groundwater, yielding specific conductance values in groundwater samples that are several times above background.
The shape of the EC curve in this interval is also characteristic of salt contamination.
Tooling and Equipment :
The equipment to perform HPT logging is simple (Figure 7). In addition to the Field Instrument (FI6000) for data acquisition, HPT requires the use of the K6300 Controller. This instrument provides the pump and pressure and flow measurement required to perform HPT logging.
HPT probes are available in both 1.75 in. (44.5mm) diameter for use with 1.5 inch (38mm) probe rods and 2.25 in. (57mm) diameter probes for use with 2.25 in. probe rods. Tools string diagrams for these probes may be found at: geoprobe.com/hpt-tool-string-diagrams.
HPT probes are robust, driveable under all Geoprobe® 54 series and 60 series hammers, and can be factory rebuilt when they wear out (provided remaining thread life is deemed sufficient).
![hpt-full-set-up--angle[1]](http://www.geoprobe.be/wp-content/uploads/2015/04/hpt-full-set-up-angle1.jpg) Fig. 7 : Instruments used for HPT Logging.
Fig. 7 : Instruments used for HPT Logging.
The K6303 HPT Controller (bottom) provides metered high pressure flow for HPT injection. Data collection and EC functions are performed by the FI 60003 instruments stacked above the HPT controller. Logging data is acquired and stored using the laptop computer.
Required Expertise:
Geoprobe® Environmental Technologies proposes training programs for operators who are new to the HPT system. In general persons familiar with direct push operations can perform HPT logging with minimal training. Some operators have trained themselves using the HPT Standard Operating Procedure (SOP). Persons who have performed EC logging can readily upgrade and use an HPT system with minimal additional training. New operators should always practice with an HPT system in an actual in-ground logging exercise before using the HPT on a site investigation project.
HPT combined with other logging techniques:
The HPT is often combined with other Geoprobe® DI logging technologies. These include the following:
MIP: The “MiHpt“ is a combined MIP-HPT system. The MIP’s information on position of VOC’s is always more useful when formation permeability is known.
CPT: The HPT has been used as a surrogate for U(2) pore pressure measurements, especially in unsaturated zones. The HPT is also a dependable indicator of seepage zones from dams and levees.
HPT-GWS Sampler: This unique tool allows the user to perform HPT logging then stop at appropriate depths to obtain groundwater samples.
Information on all of these logging technologies can be found on www.geoprobe.com (http://geoprobe.com/hpt-hydraulic-profiling-tool). In each of these tool combinations the HPT serves as the “workhorse” for permeability definition. The Standard K6303 HPT controller is used in the instrument set for each of these techniques.